Workload Detail#
The workload detail page provides an overview of a single workload, including real-time GPU metrics for each device assigned to the workload and detailed information about the workload itself.
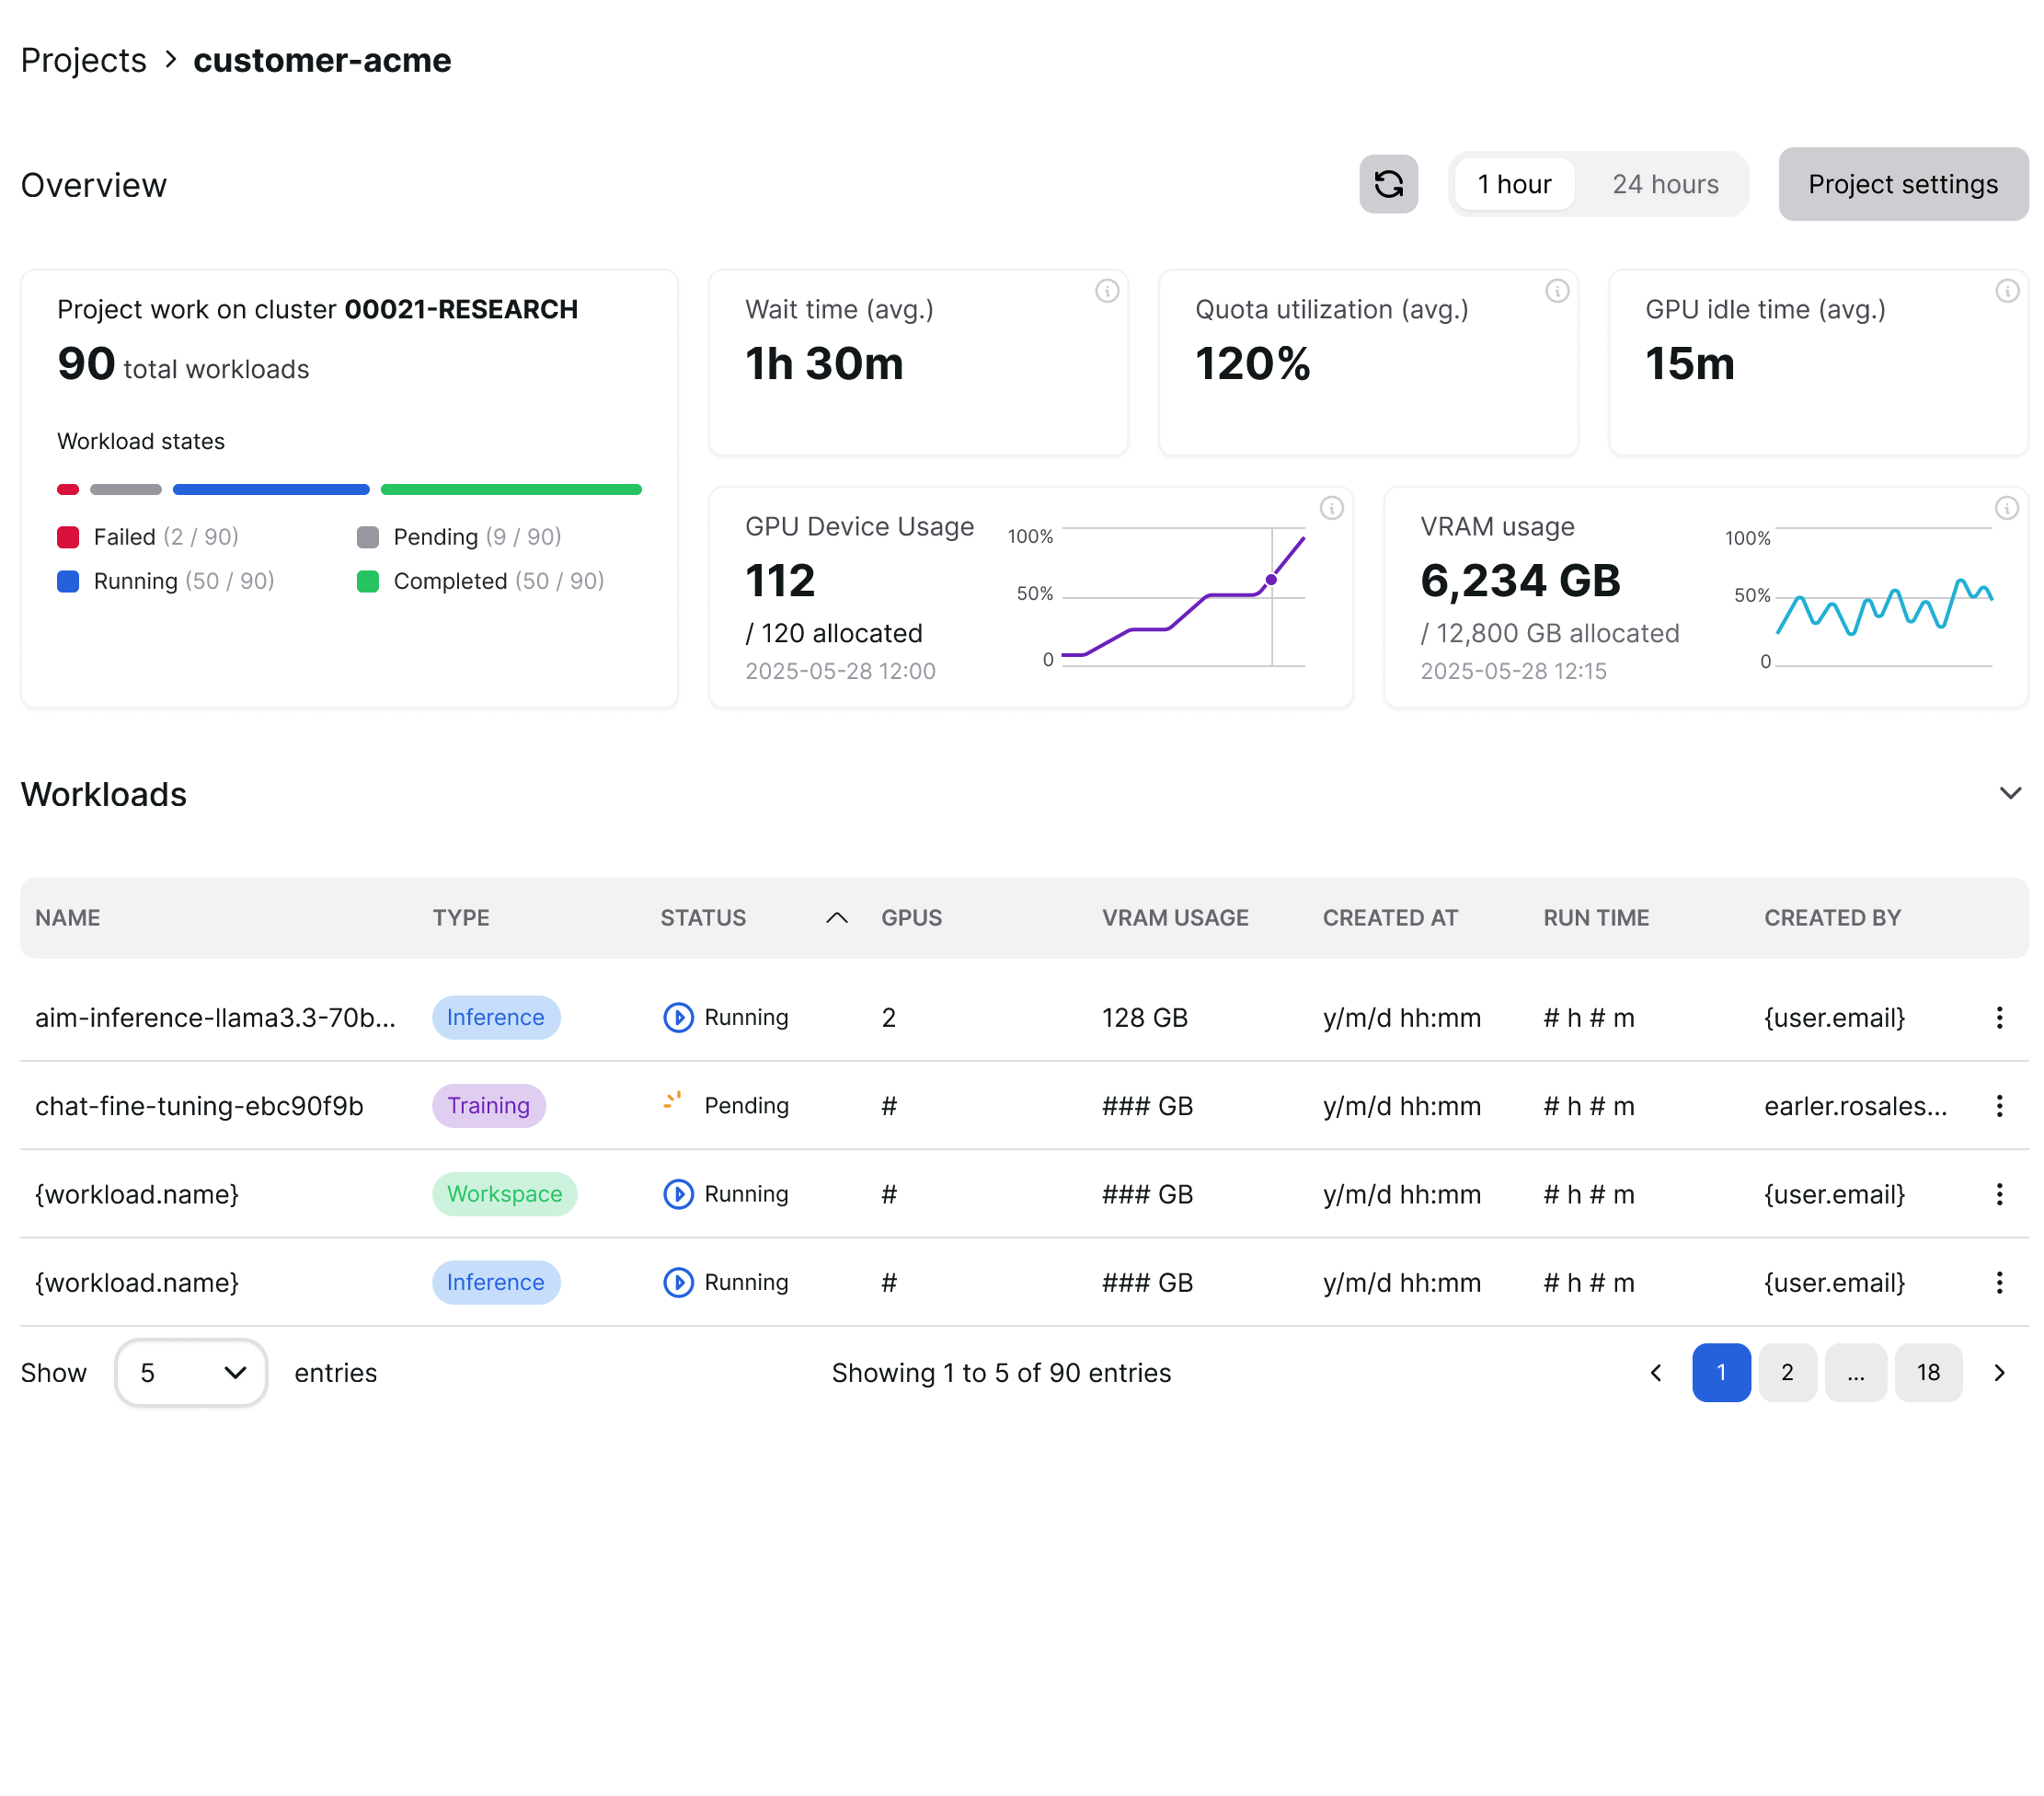
Navigating to a workload#
Open the Workloads list from the Project page and click on a workload name to open its detail page.
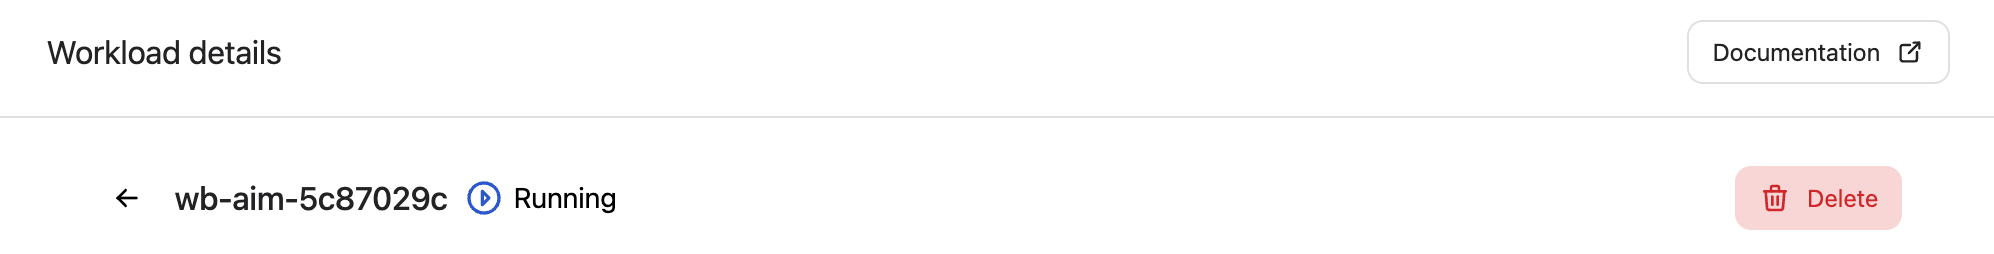
Header#
The page header displays the workload name and its current execution status. From here you can also delete the workload using the Delete button.
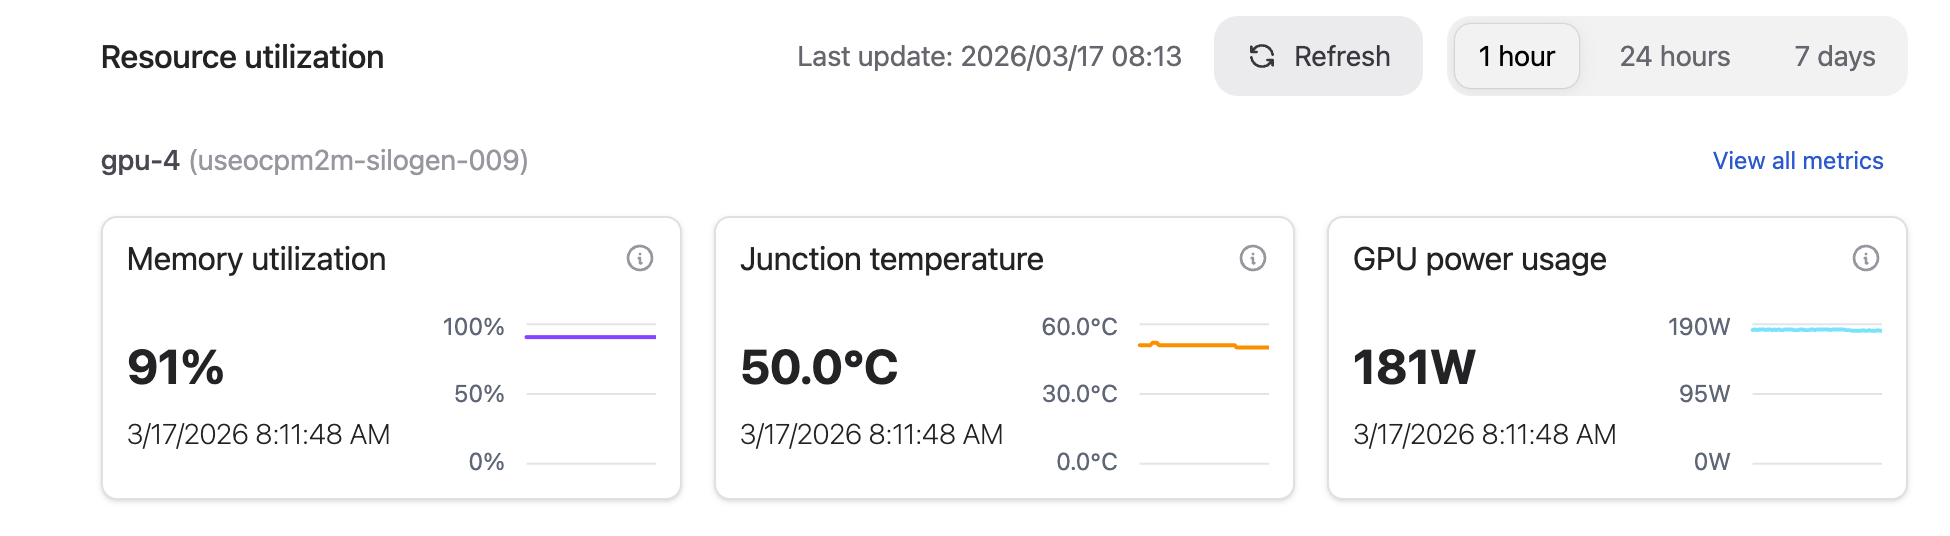
Resource utilization#
The Resource utilization section shows live GPU metric charts for each device assigned to the workload. The header row displays the timestamp of the last update and provides controls for refreshing and filtering the data:
Refresh – manually re-fetches all metric charts using the current time range.
1 hour / 24 hours / 7 days – sets the time window shown in the charts.

Per-device metric cards#
Devices are listed by GPU identifier and hostname. Each device shows three metric cards side by side:
Memory utilization – VRAM consumed as a percentage of total GPU memory.
Junction temperature – Die (hotspot) temperature in °C.
GPU power usage – Instantaneous power draw in watts.
Each card displays the most recent value alongside a line chart for the selected time range.
If no GPU metrics are available for the workload, a message is shown in place of the charts.
View all metrics#
Selecting View all metrics next to a device name navigates to the node detail page for the host node that GPU belongs to. From there you can explore the full set of per-GPU charts including clock speed, GPU usage, memory and junction temperature, power consumption, and PCIe traffic.
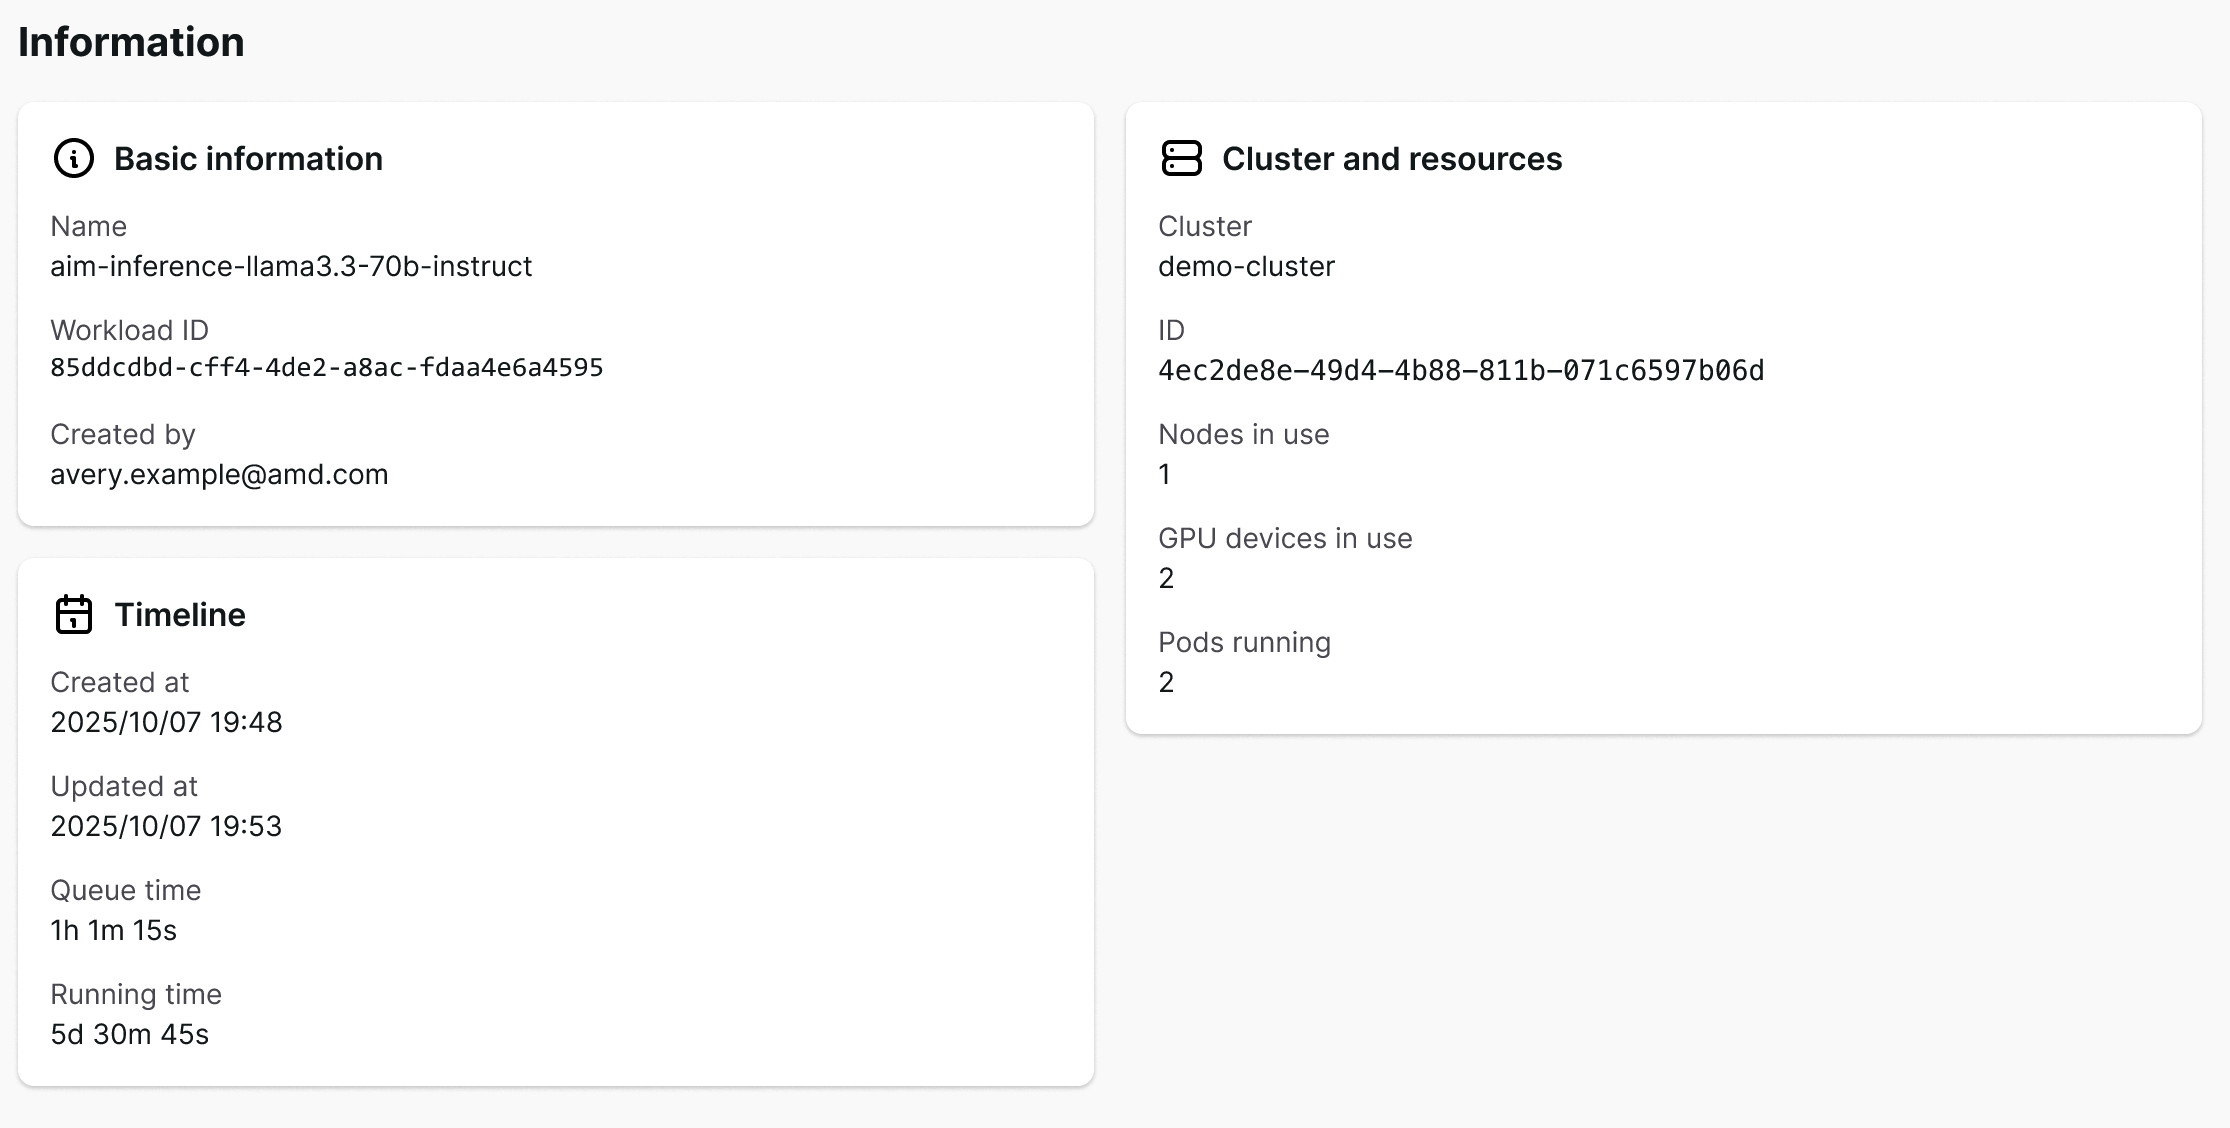
Information#
The Information section contains three cards with static details about the workload.
Basic information#
Name – Display name or internal name of the workload.
Workload ID – Unique identifier assigned to the workload.
Created by – Email address of the user who created the workload.
Cluster and resources#
Cluster – Name of the cluster the workload is running on.
ID – Unique identifier of the cluster.
Nodes in use – Number of cluster nodes currently used.
GPU devices in use – Total number of GPU devices allocated to the workload.
Timeline#
Created at – Date and time the workload was created.
Updated at – Date and time of the last status update.
Queue time – Duration the workload spent waiting before running.
Running time – Duration the workload has been in the running state.