Dashboard#
The AI Workbench dashboard provides a high-level overview of recent activity and resource usage in AI Workbench. It summarizes your current workloads, showing how many are running or pending, and highlights GPU device and VRAM usage over time. Below the overview, a detailed list of workloads displays their type, status, resource consumption, creation time, and owner, allowing you to quickly assess system utilization and the state of your active inference jobs.
Workloads#
A workload is a batch job or a service running in the cluster with resources defined by the workload and, when used in a resource managed cluster, limited by the resource quota that the owner has. This page shows all started workloads. The view shows all workload statuses by default except Deleted.
If AI Workbench is used together with the Resource Manager and a user belongs to multiple projects, the project needs to be selected first from the top of the page.

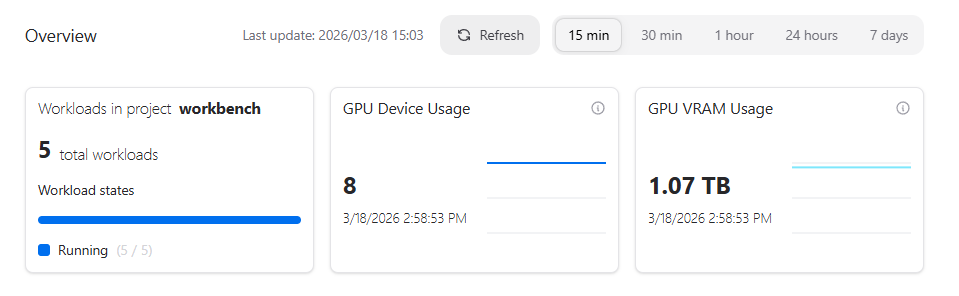
The Overview section gives a snapshot of your current AI Workbench usage. It shows the total number of workloads and their current state (running vs. pending), along with aggregated GPU device usage and total GPU VRAM consumption. This section is designed to let you quickly understand overall system load and resource utilization at a glance before diving into individual workloads.
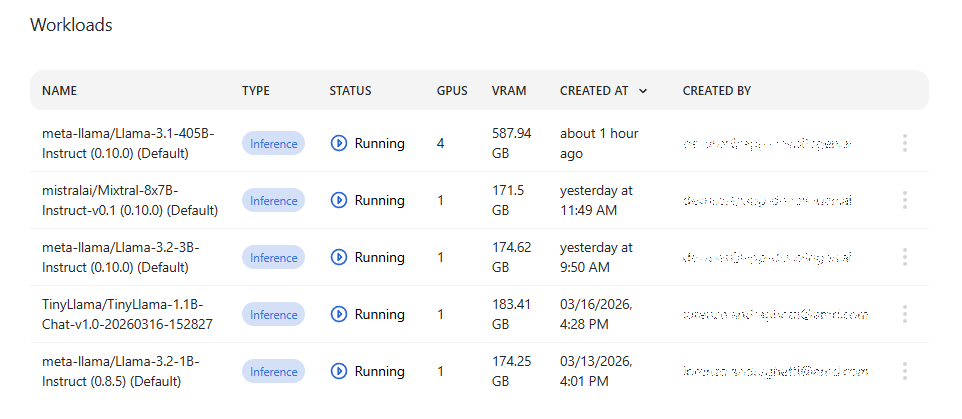
The paginated Workloads table shows the name and type of the workload, and how many resources the workload requires. The Status column shows the last known status of the workload and is not updated automatically.
Actions#
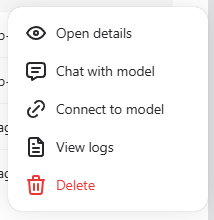
Workload actions are available from the actions column by pressing the three-dot button.
Available actions:#
Open details – Opens the workload details page which displays metadata about the workload, such as when it was created and by whom and what sub-components it consists of.
Open workspace – If the workload type is
Workspace, selecting this action opens the workspace in a new browser tab.Chat with model – If the workload type is
Inference,opens the model pre-selected in the Chat view.Connect to model – If the workload type is
Inference, displays a connection info modal for interacting with the model programmatically.View logs – Allows viewing logs and Kubernetes events produced by the workload.
Delete – Queues the workload for deletion.
Workload types#
Type |
Description |
|---|---|
Inference |
Inference service (AIM or fine-tuned model) |
Fine-Tuning |
Model fine-tuning batch job which generates a new model |
Workspace |
Workspace for model development and experiments |
Workload statuses#
Status |
Description |
Condition |
|---|---|---|
Added |
Workload has been created |
Workload component creation has not started |
Pending |
Waiting to start |
All components are in the |
Running |
Workload is being executed |
Any component is in the |
Complete |
Workload has finished successfully |
All components are in the |
Failed |
An error has occurred and the workload did not complete |
Any component is in the |
Deleting |
Workload is queued for removal |
Delete started, but not all components are |
Deleted |
Workload successfully deleted |
All components are in the |
Delete Failed |
Delete failed and manual cleanup might be needed |
Any component is in the |
Terminated |
Execution has been terminated |
All components are in the |
Unknown |
Status cannot be determined |
Workload logs#
Workload logs provide near real-time visibility into the execution and status of running workloads. The logging functionality allows users to monitor workload progress, troubleshoot issues, and analyze performance.
Accessing logs#
Logs can be accessed through the workload details view:
Navigate to the Dashboard, Models or Workspaces page
Open the action menu (
⁝icon) on a workload item and use the Open details actionClick the Logs button in the workload details page
Alternatively you can also access the logs directly from the workload action menu by selecting View logs
Log features#
Log sources: Currently we support stdout/stderr collection from the running workloads and Kubernetes events emitted by the workload pods
Real-time streaming: Logs can be streamed in near real-time for active workloads and stored for later analysis for completed workloads. To enable real-time streaming, click the Enable log streaming toggle in the log viewer.
Log levels: View logs by severity level (Trace, Debug, Info, Unknown, Warning, Error, Critical)
Timestamps: All log entries include precise timestamps for chronological tracking sorted in descending order (newest first)
Log retention#
Logs are retained until disk space is needed; there is no fixed retention period
When disk usage is high, older logs are rotated and deleted to free up space
Typical retention is currently 1–2 weeks, but this may vary depending on workload volume and disk usage
Pending workloads: Event logs are available upon workload creation
Active workloads: Workload logs are available immediately upon workload start
Completed workloads: Historical logs remain accessible until rotated out
Failed workloads: Runtime error logs are preserved like other logs, subject to rotation policy
Log types by workload#
Workload Type |
Available Logs |
|---|---|
Inference |
Request/response logs, model loading, performance metrics |
Fine-Tuning |
Training progress, loss metrics, checkpoint saves |
Workspace |
Jupyter/VS Code server logs, user session activity |