Advanced Deployment Options#
When deploying AMD Inference Microservices (AIMs) from the model catalog, you have access to advanced configuration options that allow you to optimize your deployment for specific use cases and requirements.
Performance Metric Selection#
The performance metric option allows you to specify the optimization goal for your model deployment. This setting influences how the AIM container configures itself to best serve your workload.
Available Metrics#
Latency: Prioritizes low end-to-end latency for individual requests. Choose this metric when:
You need fast responses for real-time applications
User experience depends on quick individual predictions
You’re building interactive chatbots or live inference services
Throughput: Prioritizes sustained requests per second. Choose this metric when:
You need to process high volumes of requests
Batch processing is more important than individual response time
You’re running background inference tasks or bulk predictions
How to Select a Metric#
Navigate to the Models page and go to the AIM Catalog tab
Click Deploy on your chosen model
In the deployment drawer, locate the Performance metric section
Select your preferred metric from the dropdown:
Latency - Optimize for low response times
Throughput - Optimize for high request volume
Default - Let the AIM automatically select the best metric based on the model and hardware
Note
If you don’t specify a metric, the AIM will automatically select the most appropriate optimization based on the model type and available hardware. For most use cases, the default selection provides excellent performance.
Performance Metric Impact#
The selected metric affects:
Memory allocation strategies
Batch processing configurations
Cache utilization patterns
GPU resource scheduling
Different models may respond differently to metric selection based on their architecture and size. Larger language models typically benefit more from throughput optimization when handling multiple concurrent users, while smaller models may show better results with latency optimization.
Profile Types#
AIM deployments use one of three profile types:
Optimized Profiles:
Production-ready and fully supported
Recommended for all production workloads
Thoroughly tested and validated
Automatically selected when available for your configuration
Preview Profiles:
Suitable for testing and development
May be promoted to optimized in future releases
Generally stable but may have minor limitations
Automatically used when optimized profiles don’t exist
Unoptimized Profiles:
Not recommended for production use
May result in significantly subpar performance
Useful for testing new hardware or experimental features
Automatically used only when no optimized or preview profiles exist
Automatic Profile Selection#
The deployment system automatically handles profile selection based on availability:
When only optimized profiles exist: The deployment proceeds normally with optimal performance. No user action is required.
When only unoptimized profiles exist: The system notifies you that the deployment will use unoptimized profiles before proceeding. This typically occurs with newly released hardware or models that haven’t yet been fully optimized for your configuration.
When both optimized and unoptimized profiles exist:
With default metric: The system automatically uses optimized profiles. No notification is shown.
With custom metric (Latency or Throughput): If your selected metric is only available in unoptimized profiles, the system notifies you before proceeding. This allows you to choose whether to continue with unoptimized profiles or select a different metric.
The system never requires manual profile type selection. AMD AI Workbench handles optimization level selection automatically based on availability and your configuration.
Viewing Optimization Level#
After deployment, you can verify the optimization level used:
Navigate to the Models page and go to the Deployed Models tab.
Click on your deployed AIM to open the workload detail page.
View the AIM Details section.
The optimization level information shows whether your deployment is using optimized, preview, or unoptimized profiles. This helps you understand expected performance characteristics and plan for future optimizations.
Performance Expectations#
When using unoptimized profiles, you may experience:
Higher latency per request
Lower throughput (requests per second)
Increased resource utilization
Less stable performance characteristics
Reduced GPU efficiency
These limitations are typically temporary as AMD continues to optimize configurations for new hardware and models. Preview profiles that demonstrate stable performance are regularly promoted to optimized status.
Important
The system always prioritizes optimized profiles when available for your hardware and selected performance metric. Unoptimized profiles are only used when optimized options don’t exist for your specific configuration.
Autoscaling#
Autoscaling automatically adjusts the number of running replicas for your AIM deployment based on real-time demand. This ensures efficient resource utilization while maintaining responsiveness during traffic spikes. Autoscaling is useful when:
Your inference workload experiences variable traffic patterns
You need to handle unpredictable demand without manual intervention
You want to optimize GPU resource utilization across multiple deployments
Cost efficiency matters and you want to scale down during low-traffic periods
You’re serving production workloads with fluctuating user activity
How Autoscaling Works#
The autoscaling system monitors metrics from your running AIM and adjusts replica counts based on configured thresholds. The system evaluates metrics every 30 seconds and applies a 5-minute cooling period before scaling down to prevent flapping.
Scale-up: When demand exceeds your target threshold, the system creates additional replicas (up to your configured maximum) to handle the increased load.
Scale-down: When demand drops below the threshold and remains low through the cooling period, the system gradually removes replicas (down to your configured minimum) to free resources.
Enabling Autoscaling#
Warning
Autoscaling can only be enabled when initially deploying a model. You cannot enable or disable autoscaling on an existing deployment. Once deployed, you can only modify autoscaling configuration parameters (such as replica ranges and target values) if autoscaling was enabled at deployment time.
For new deployments:
Navigate to the Models page and go to the AIM Catalog tab.
Click Deploy on your chosen model.
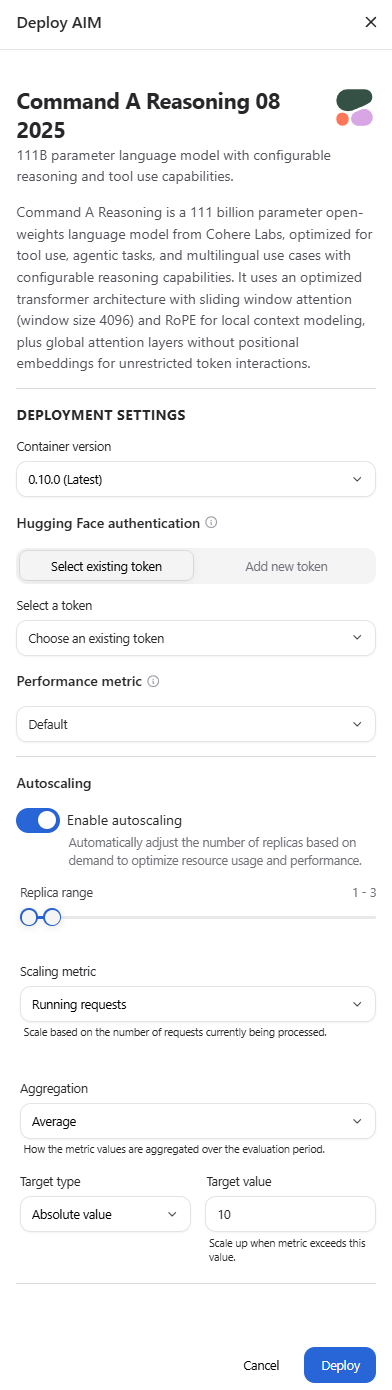
In the deployment drawer, locate the Autoscaling section.
Toggle Enable autoscaling to reveal the configuration options (see the deployment drawer screenshot in the Performance Metric Selection section above).
Configure your scaling parameters (see Configuration Parameters below).
Click Deploy to deploy the AIM with autoscaling enabled.
To update autoscaling configuration on existing deployments (only if autoscaling was enabled at deployment time):
Navigate to the Models page and go to the Deployed Models tab.
Click on your deployed AIM to open the workload detail page.
Locate the Autoscaling card.
Click Settings to open the deployment settings drawer.
Adjust your autoscaling configuration parameters as needed.
Click Save to apply the new scaling policy.
Changes to autoscaling configuration on running deployments take effect within approximately 30 seconds.
Note
Configuring autoscaling from AMD AI Workbench supports a limited set of common configuration options. More options can be explored by configuring AIM scaling via CLI/kubectl.
Configuration Parameters#
The autoscaling form provides several parameters to control scaling behavior:
Replica Range
Defines the minimum and maximum number of replicas (1-30):
Minimum replicas: The baseline number of replicas that always run, ensuring minimum capacity even during zero traffic. Default is 1.
Maximum replicas: The upper limit for scaling, preventing runaway resource consumption during extreme traffic spikes. Default is 3.
A higher minimum guarantees capacity and faster response to sudden traffic increases, while a higher maximum accommodates larger traffic bursts.
Scaling Metric
The vLLM signal that drives scaling decisions:
Running requests (default): The number of requests currently being processed by the inference engine. Works well for most workloads and provides stable scaling based on active load.
Waiting requests: The number of requests queued and waiting for processing. Reacts proactively before latency degrades, as a growing queue indicates saturation before response times increase.
Choose running requests for stable, reactive scaling. Choose waiting requests for proactive scaling that prevents queue buildup.
Aggregation
How metric values across all pods are combined during each evaluation period:
Average (default): Calculates the average metric value across all pods. Best for stable, gradual scaling that responds to overall system load.
Maximum: Uses the highest value observed across any pod. Reacts aggressively to peak load on any single replica, ensuring no pod becomes overloaded.
Minimum: Uses the lowest value across all pods. Only triggers scale-up when every pod is busy, making it the most conservative option.
For most workloads, average aggregation provides the best balance. Use maximum for latency-sensitive workloads where any pod saturation is unacceptable.
Target Type
How the target value is interpreted for scaling decisions:
Absolute value (default): Scales when the total metric across all pods exceeds the target. For example, with a target of 10, scale-up occurs when total running requests exceed 10 regardless of pod count.
Average per pod: Scales when the average metric per pod exceeds the target. Normalizes the threshold across the current replica count, maintaining consistent per-replica load targets regardless of how many replicas are running.
Absolute value works well for small deployments with few replicas. Average per pod is typically better for larger deployments or when you want to ensure each replica handles a similar load.
Target Value
The numeric threshold that triggers scaling decisions. Default is 10.
Higher values allow more requests per replica before scaling up, maximizing resource utilization but potentially increasing latency
Lower values trigger scaling at lighter load, improving responsiveness but using more resources
The optimal target depends on your model size, hardware, and latency requirements. Start with the default and adjust based on observed performance.
Example Configuration#
With the following settings:
Replica range: 1-5
Scaling metric: Running requests
Aggregation: Average
Target type: Absolute value
Target value: 10
The system scales up when the total number of running requests across all pods exceeds 10, adding replicas until demand decreases or the maximum of 5 replicas is reached. When traffic drops and running requests fall below 10 for the cooling period, replicas are removed down to the minimum of 1.
Monitoring Autoscaling Behavior#
After enabling autoscaling, monitor your deployment’s scaling activity:
Navigate to the Models page and go to the Deployed Models tab
Click on your deployed AIM to open the workload detail page
Locate the Autoscaling card, which displays:
Current number of running replicas
Active scaling metric and target value
Real-time scaling status
The card updates in real time as replicas are added or removed. See Inference Metrics for detailed information about monitoring your deployments.
Warning
Autoscaling works optimally in single-project environments or within a guaranteed quota. When resources are borrowed from other projects, autoscaled pods may be preempted, when other projects reclaim their guaranteed quota.
Updating Autoscaling#
You can update autoscaling configuration parameters on deployments that have autoscaling enabled. This allows you to tune scaling behavior without redeploying. However, you cannot enable autoscaling on a deployment that was created without it, nor can you disable autoscaling on a deployment that has it enabled.
Start with default settings and adjust based on observed behavior:
If replicas scale up too aggressively:
Increase the target value to allow more load per replica
Switch aggregation from maximum to average
Switch from waiting requests to running requests for less reactive scaling
Widen the replica range to allow more headroom
If replicas don’t scale up fast enough:
Decrease the target value to trigger scaling earlier
Switch from running requests to waiting requests for proactive scaling
Change aggregation to maximum to react to any pod saturation
Consider increasing the minimum replica count for better baseline capacity
If replicas flap (scale up and down repeatedly):
Increase the target value to provide more stability margin
Use average aggregation instead of maximum
Consider increasing the minimum replica count if baseline traffic justifies it
The 5-minute cooling period for scale-down helps prevent flapping, but inappropriate target values or aggregation methods can still cause instability.
Monitoring Deployment Performance#
After deploying with custom options, monitor your deployment’s performance:
Navigate to the Models page and go to the Deployed Models tab
Click on your deployed AIM to open the workload detail page
View the Inference metrics section
Key metrics to watch:
Time to First Token: Indicates responsiveness (latency-focused)
Throughput: Shows requests per second (throughput-focused)
Resource Utilization: Helps identify if configuration is appropriate
See Inference Metrics for detailed information about monitoring your deployments.
Best Practices#
Start with defaults: Use default settings unless you have specific requirements
Be aware of optimization levels: When notified about unoptimized profiles, carefully consider whether to proceed based on your use case (testing vs. production)
Enable autoscaling for variable workloads: Use autoscaling for production deployments with fluctuating traffic to optimize resource utilization
Set appropriate replica minimums: For production workloads, consider setting minimum replicas higher than 1 to ensure baseline capacity and faster response to traffic spikes
Monitor before tuning: Observe autoscaling behavior for at least 24 hours before adjusting configuration parameters
Test thoroughly: When using preview or unoptimized deployments, conduct thorough performance testing before production use
Monitor actively: Keep an eye on metrics to ensure your configuration meets expectations
Check optimization level after deployment: Review the AIM Details section to verify which optimization level is being used
Stay updated: Check release notes for when preview profiles are promoted to optimized
Contact support: Work with AMD support when deploying on new hardware or encountering performance issues
Troubleshooting#
Deployment Shows Unoptimized Profile Notification#
If you receive a notification that only unoptimized profiles are available:
Verify your hardware is supported for this model
If testing or development: Proceed with the unoptimized deployment by confirming the notification
If using a custom performance metric: Try switching to the default metric to see if optimized profiles are available
Check the AIM catalog for alternative models that have optimized profiles for your hardware
Contact AMD support for information about optimization timelines for your hardware configuration
Performance Lower Than Expected#
If your deployed model shows poor performance:
Check if you’re using an unoptimized or preview profile (visible in deployment details)
Try different performance metrics (latency vs throughput)
Review the inference metrics to identify bottlenecks
Ensure you’re using the latest AIM version (check for updates in the catalog)
If autoscaling is enabled, verify that replicas are scaling as expected and consider adjusting the target value or minimum replica count
Autoscaling Not Triggering#
If replicas don’t scale up despite increased load:
Verify autoscaling is enabled in the deployment settings
Check that your target value isn’t too high for the current traffic level
Review the active scaling metric and ensure it aligns with your workload characteristics
Confirm you haven’t reached the maximum replica count
Check the Autoscaling card on the workload detail page for real-time metric values
Replicas Scale Down During Active Traffic#
If replicas are removed while serving requests:
Your target value may be too high, making the system think capacity is excessive
The aggregation method (especially minimum) may not reflect actual load distribution
Consider switching from absolute value to average per pod for better per-replica awareness
Increase the minimum replica count if baseline traffic justifies more capacity