Node GPU Metrics#
The node detail page provides per-GPU metric charts for each node in a cluster. Use these charts to monitor GPU health, resource consumption, and interconnect performance over time.
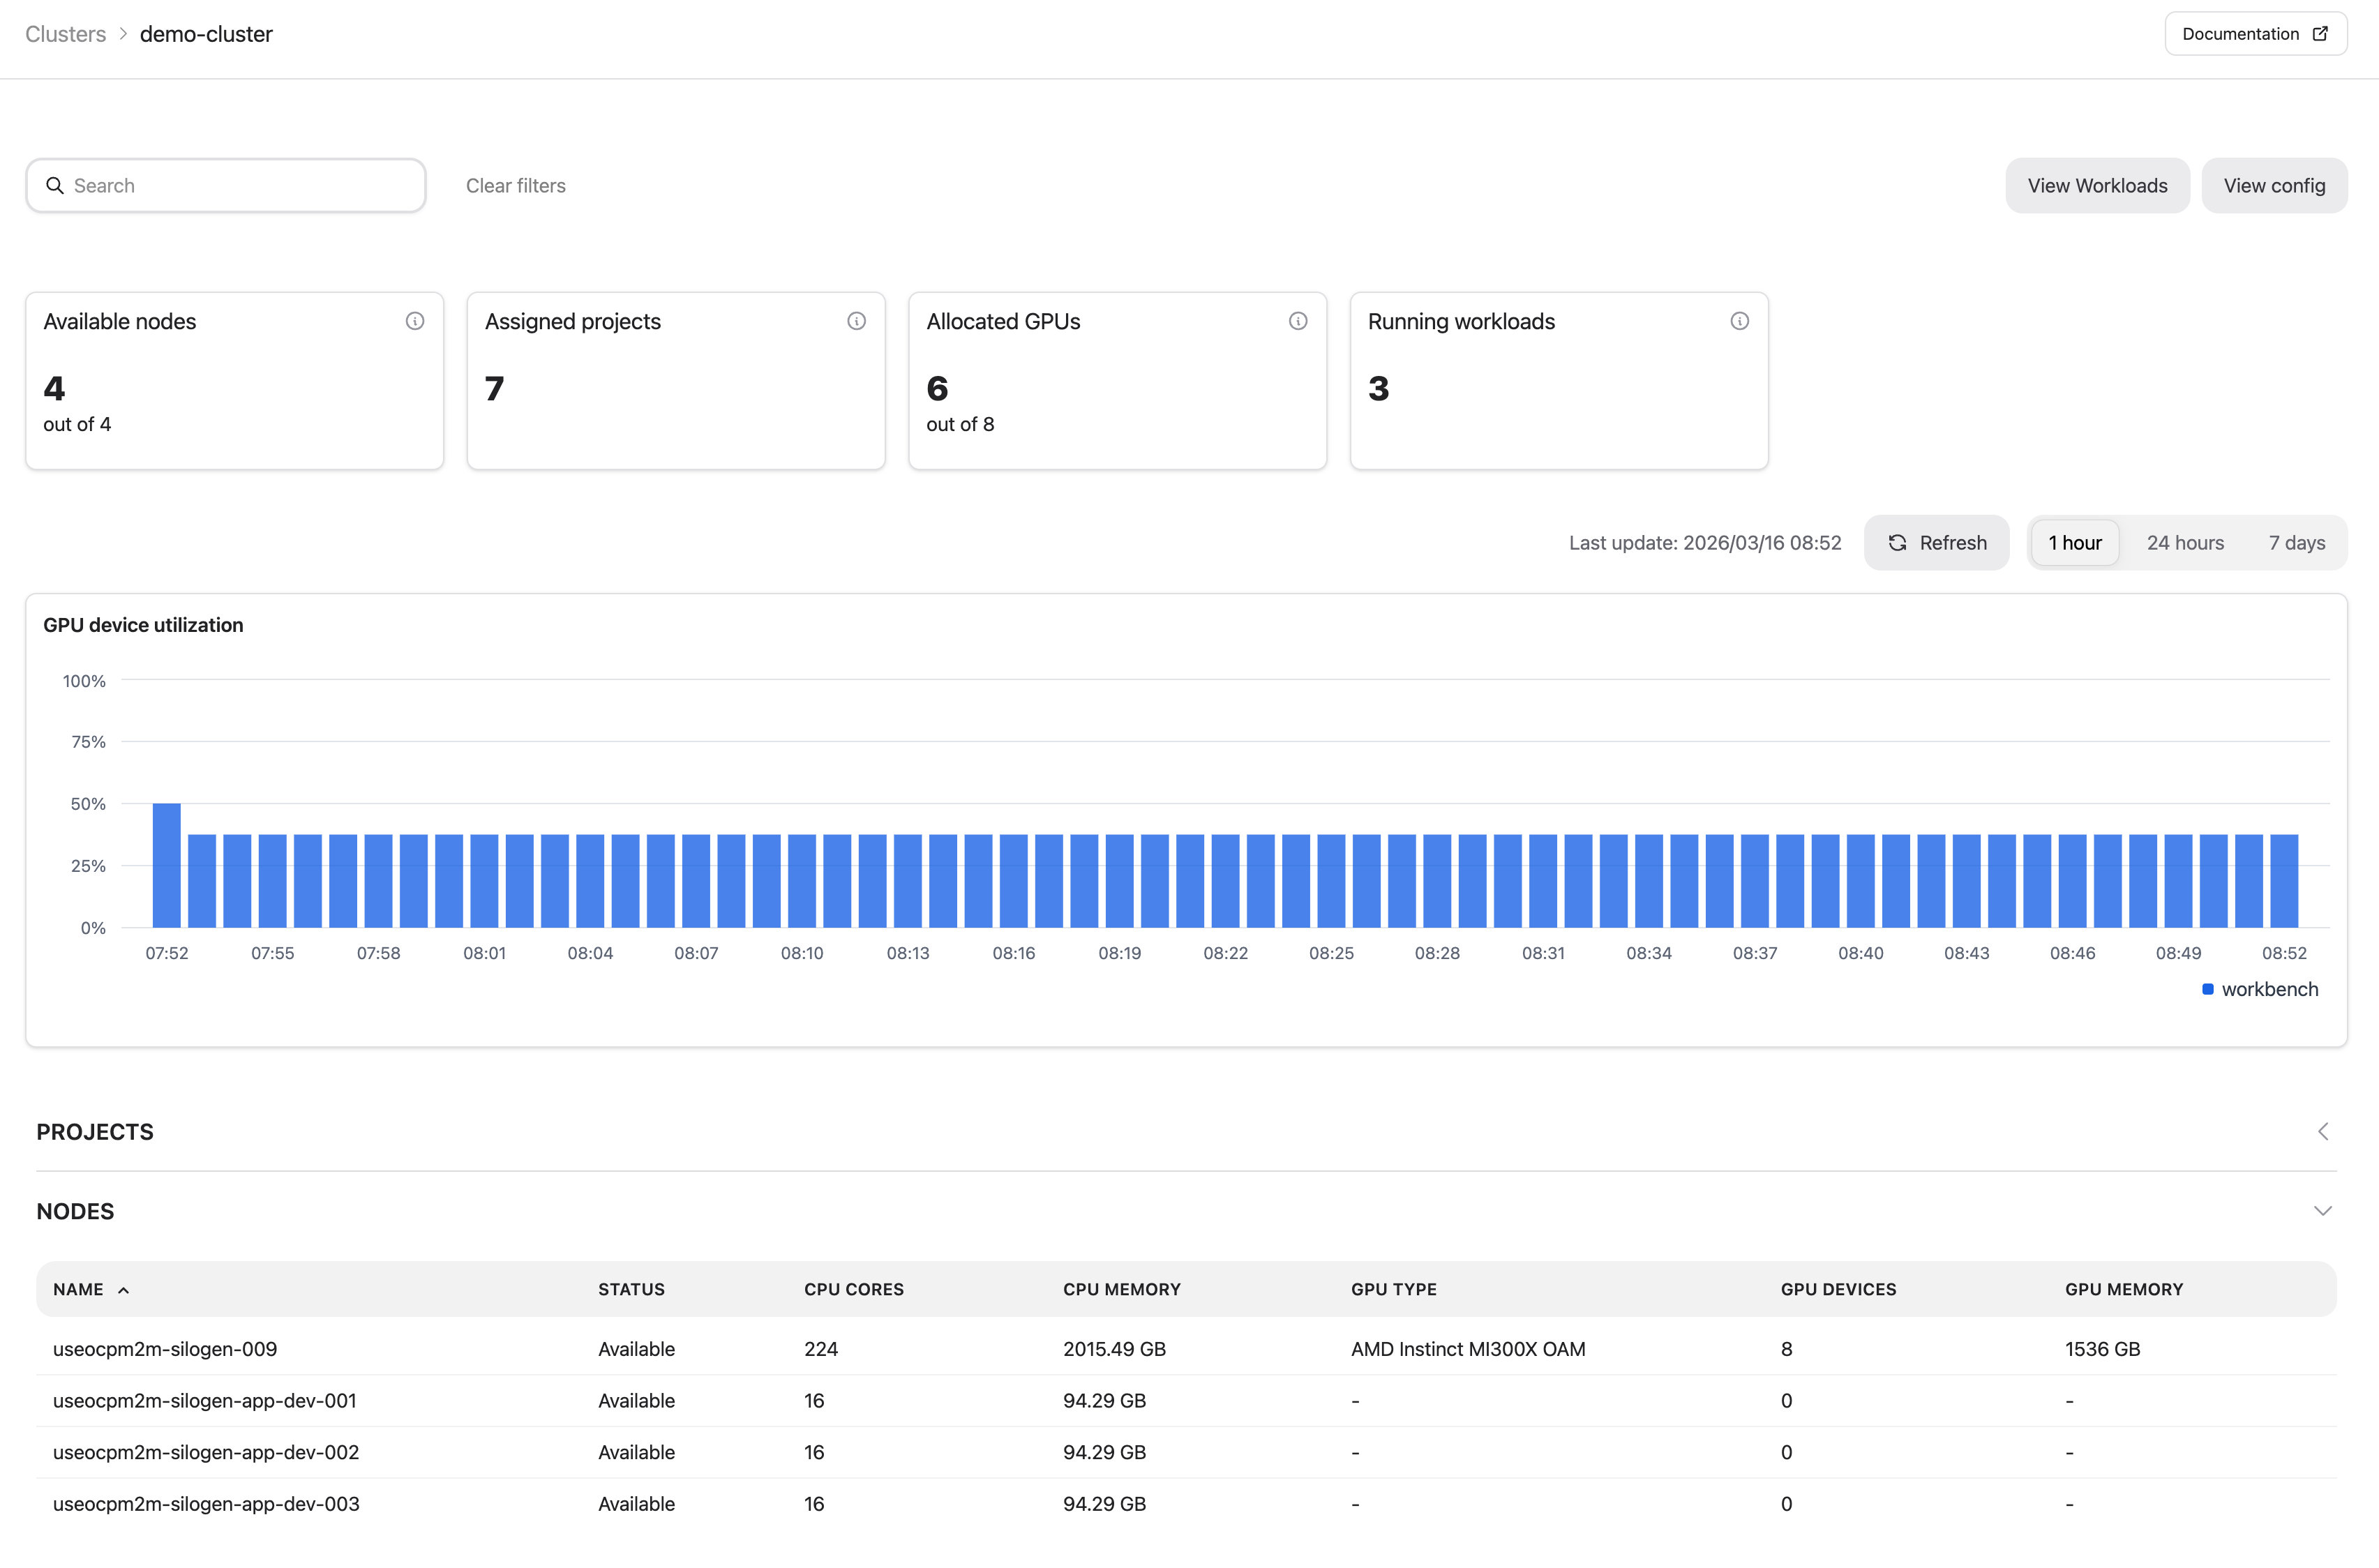
Navigating to a node#
Open a cluster from the Clusters page, then select a node from the nodes table to open its detail page.
Filtering and time range#
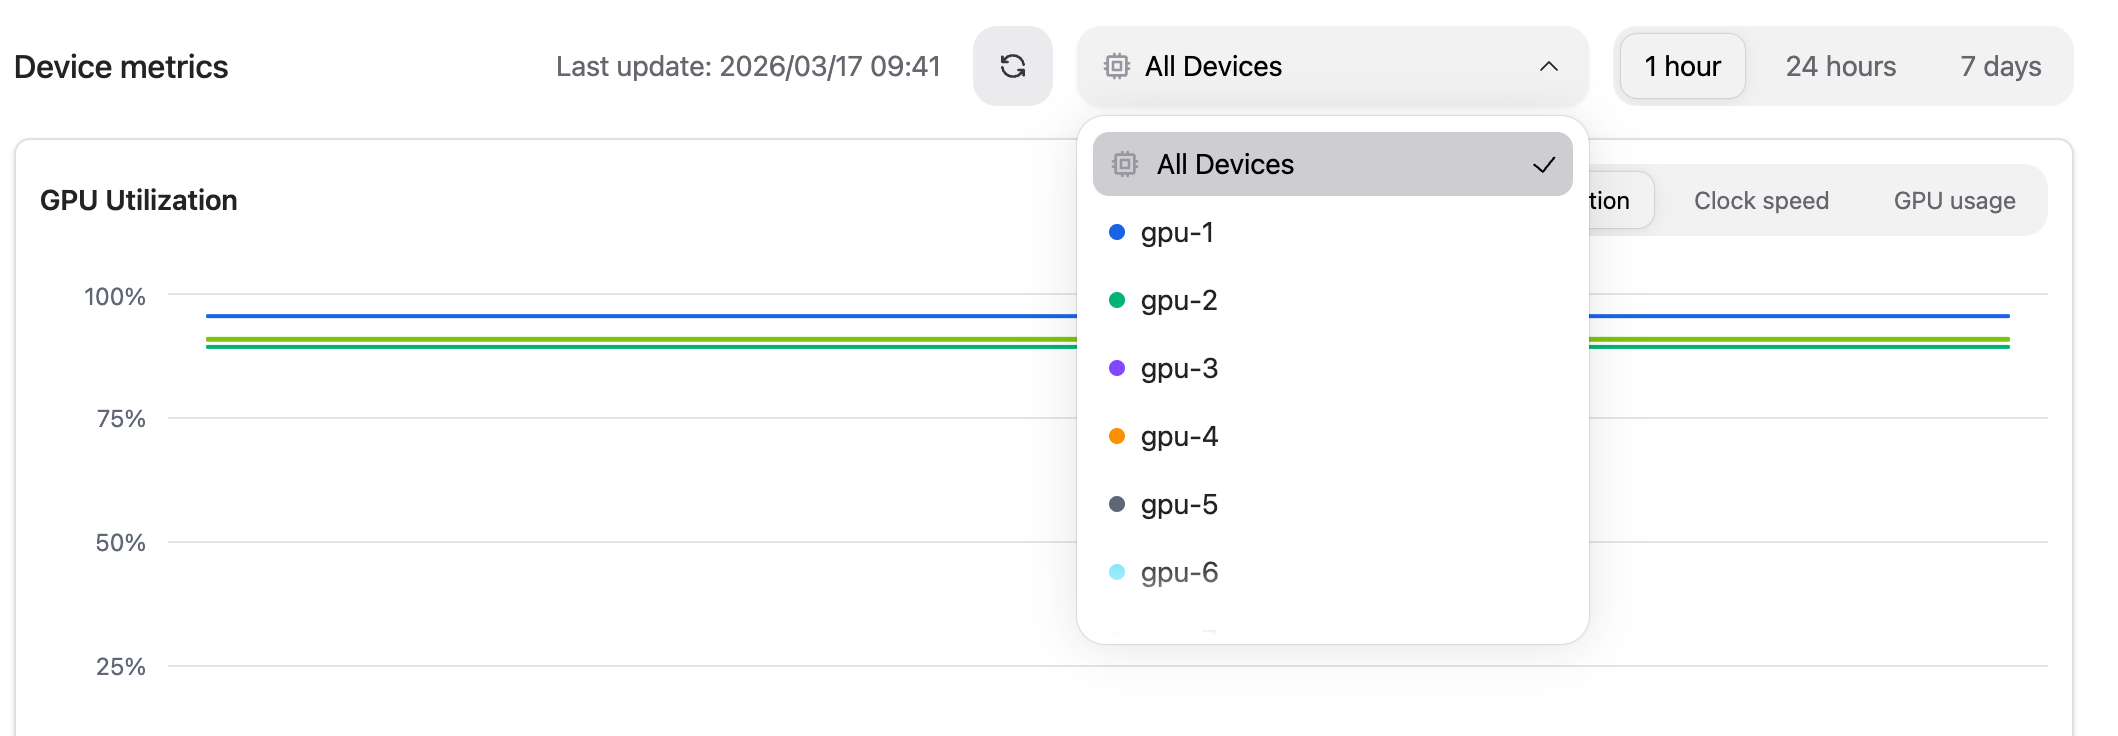
At the top of the Device metrics section you can:
Filter by device – restrict charts to a specific GPU using the device selector.
Set the time range – choose between the last 1 hour, 24 hours, or 7 days.
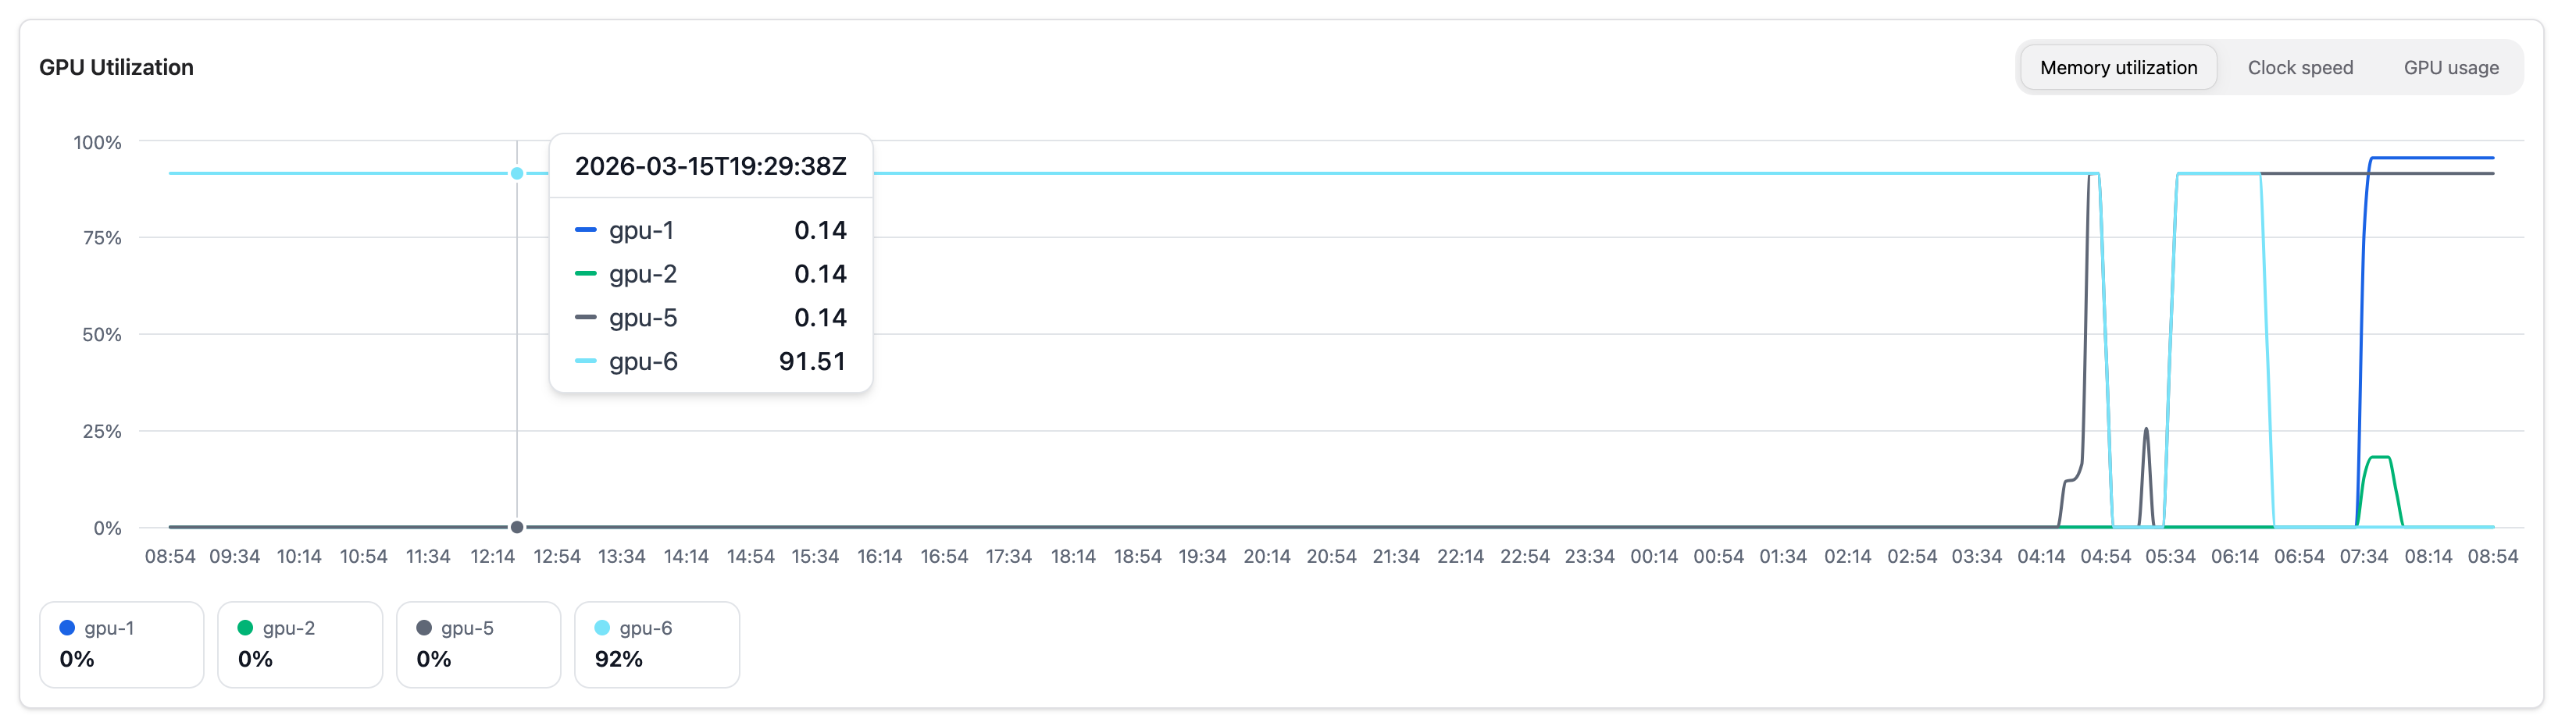
GPU Utilization#
Shows GPU activity over time. Switch between three views using the tabs:
Tab |
Description |
|---|---|
Memory utilization |
VRAM used as a percentage of total GPU memory |
Clock speed |
GPU clock frequency in MHz |
GPU usage |
Compute activity (GFX activity) as a percentage |
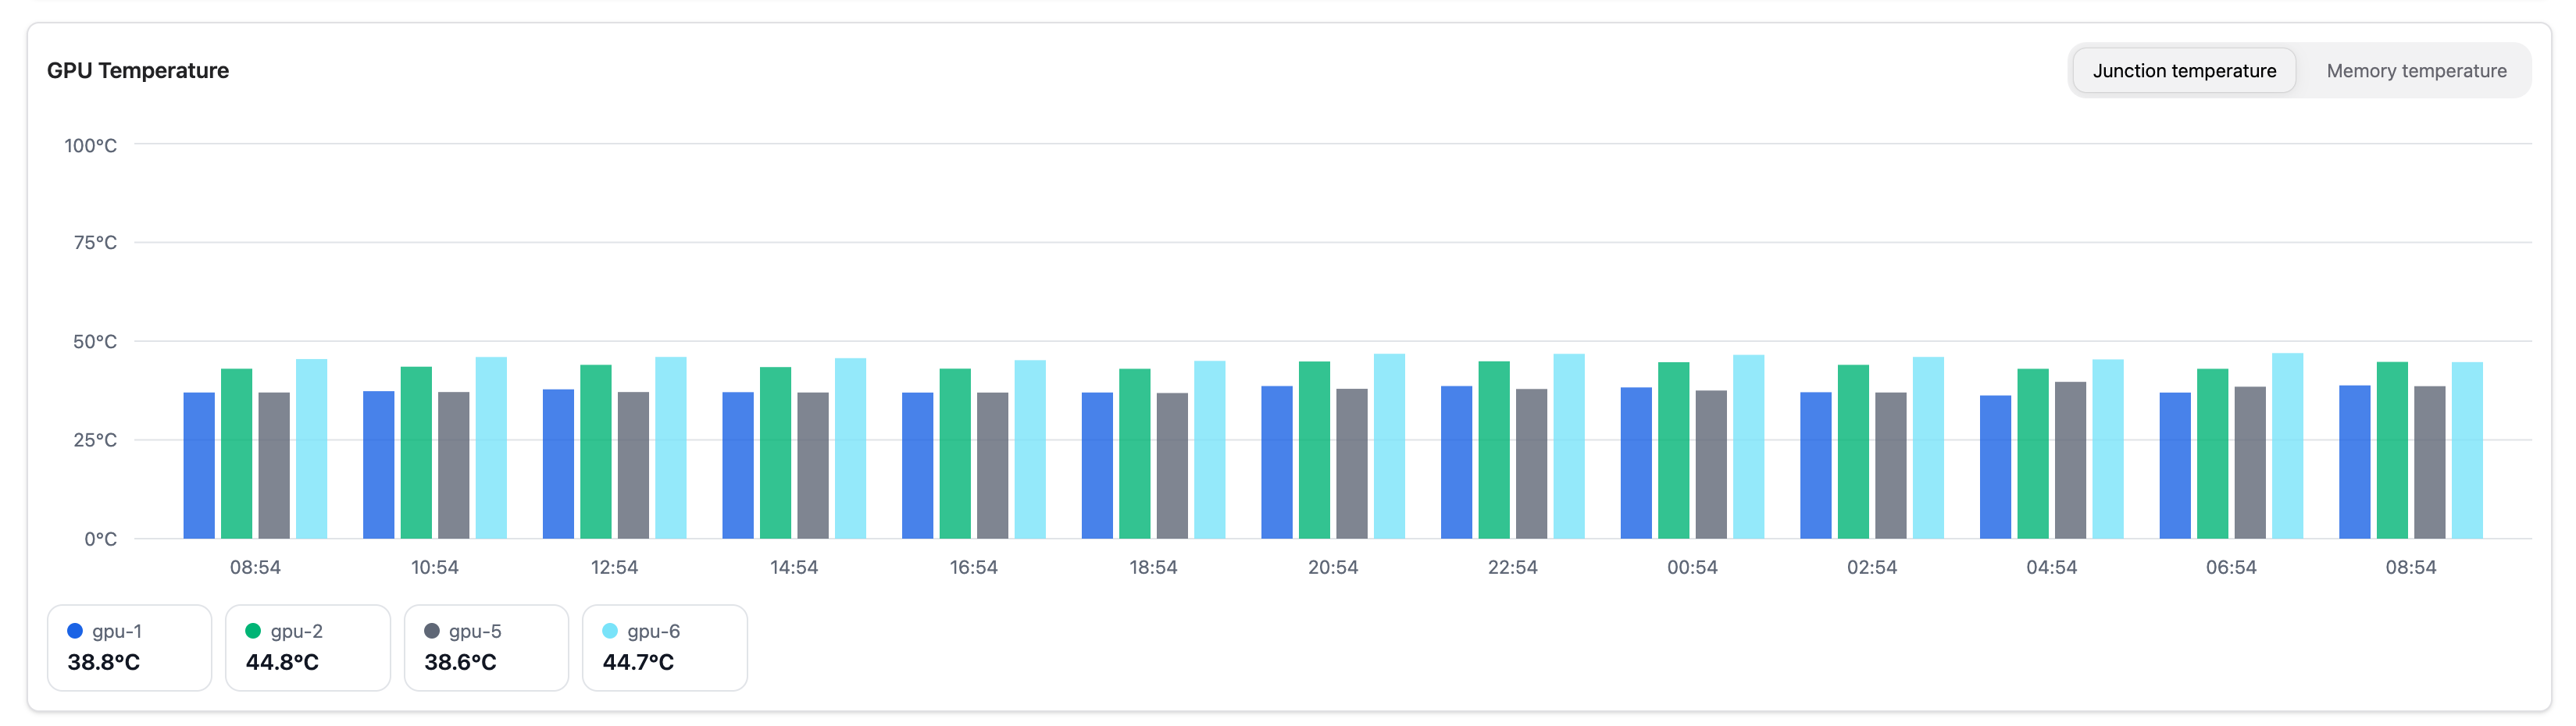
GPU Temperature#
Shows thermal metrics over time. Switch between two views:
Tab |
Description |
|---|---|
Junction temperature |
Die (hotspot) temperature in °C |
Memory temperature |
HBM memory temperature in °C |
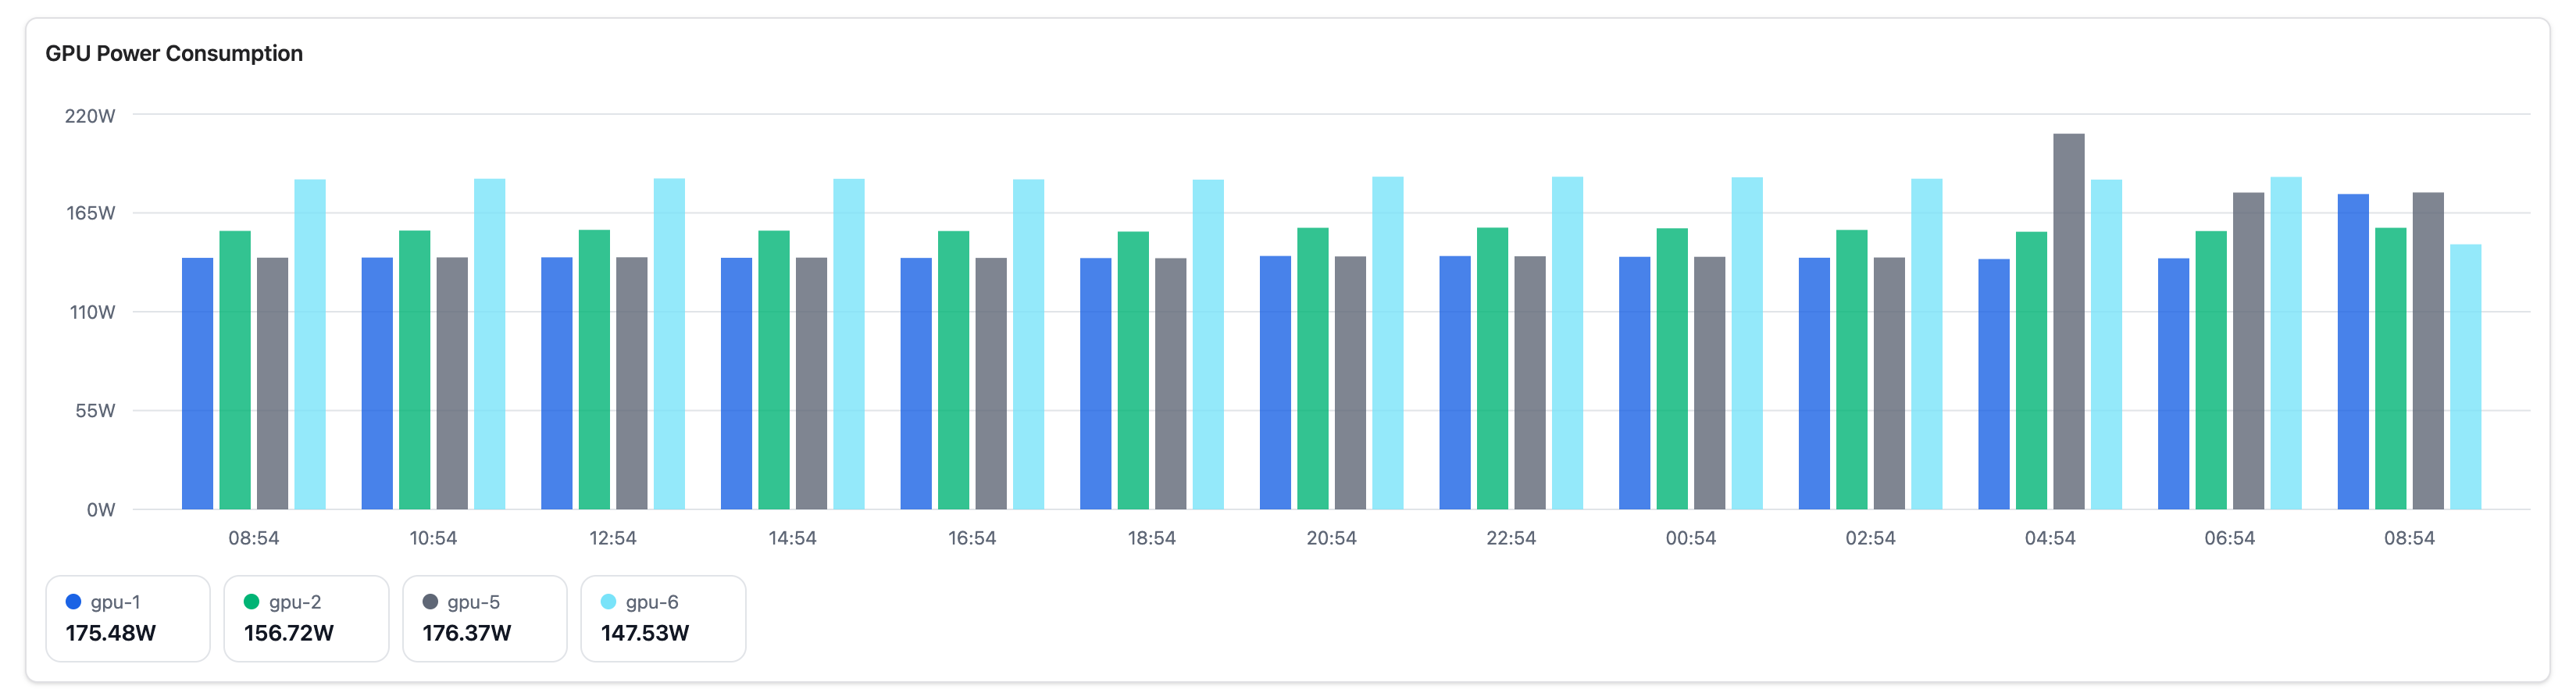
GPU Power Consumption#
Shows the power draw in watts for each GPU over time.
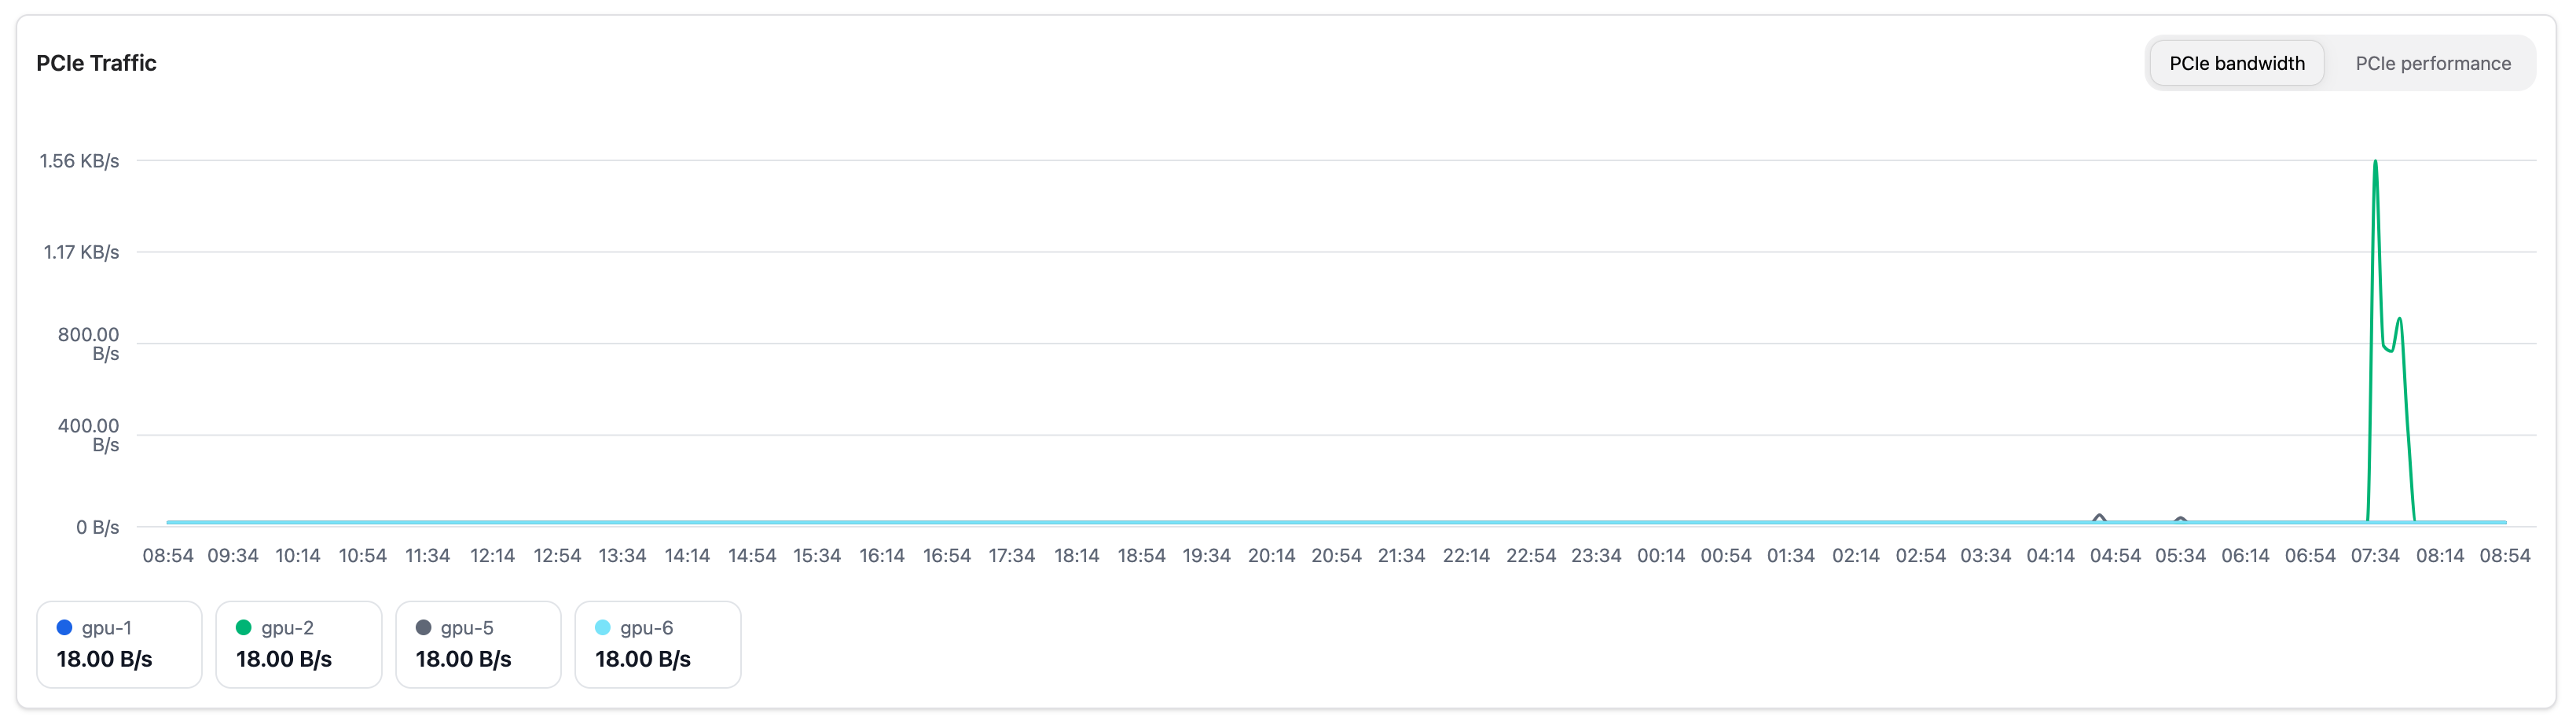
PCIe Traffic#
Shows PCIe interconnect data over time. Switch between two views using the tabs:
Tab |
Description |
|---|---|
PCIe bandwidth |
Raw data throughput (B/s, KB/s, MB/s, or GB/s depending on scale) |
PCIe performance |
Link speed as a percentage of the GPU’s maximum PCIe link speed (0–100%) |
PCIe bandwidth is useful for identifying whether the interconnect is a bottleneck for data-intensive workloads. PCIe performance (efficiency) shows how much of the available link capacity is in use and is useful for checking whether the link is operating at its expected generation and width.
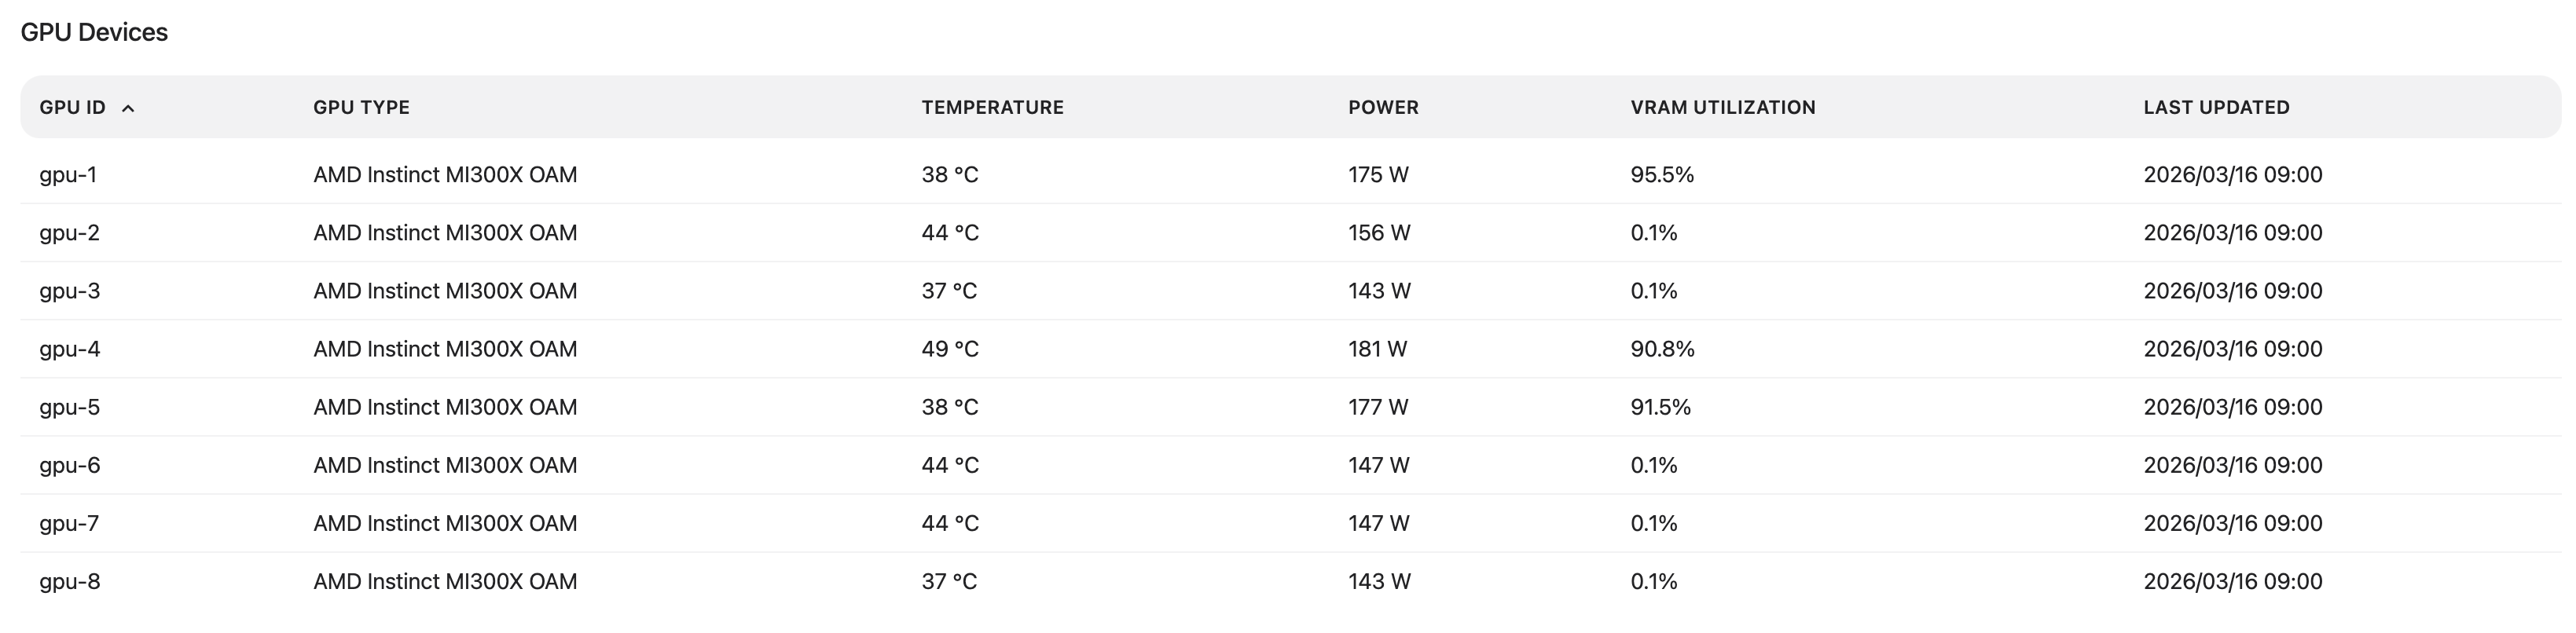
GPU Devices#
Below the charts, the GPU Devices table lists each GPU on the node together with its current snapshot values for memory utilization, junction temperature, memory temperature, and power usage.
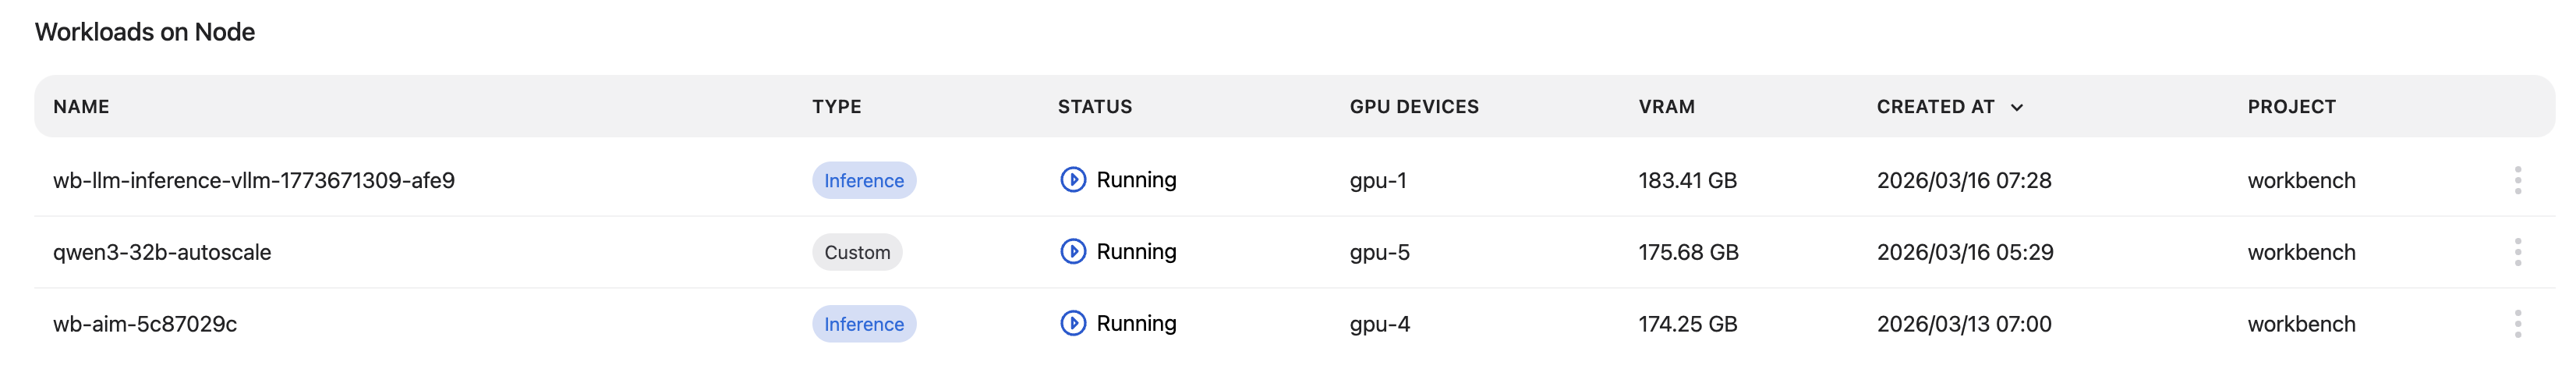
Workloads on Node#
The Workloads on Node table shows the workloads currently running on this node.
Column |
Description |
|---|---|
Name |
Unique identifier of the workload |
Type |
Workload type (e.g. Inference, Custom) |
Status |
Current execution status (e.g. Running, Pending, Failed) |
GPU Devices |
GPU device(s) assigned to the workload on this node |
VRAM |
Amount of GPU memory consumed by the workload |
Created at |
Date and time the workload was created |
Project |
Project the workload belongs to |